Cash-back retail media
The Cash-Back Claim Test That Rewarded Pre-Existing Purchase Intent
A realistic cash-back marketplace scenario showing how offer claiming can turn pre-existing purchase intent into an overstated sales lift claim.
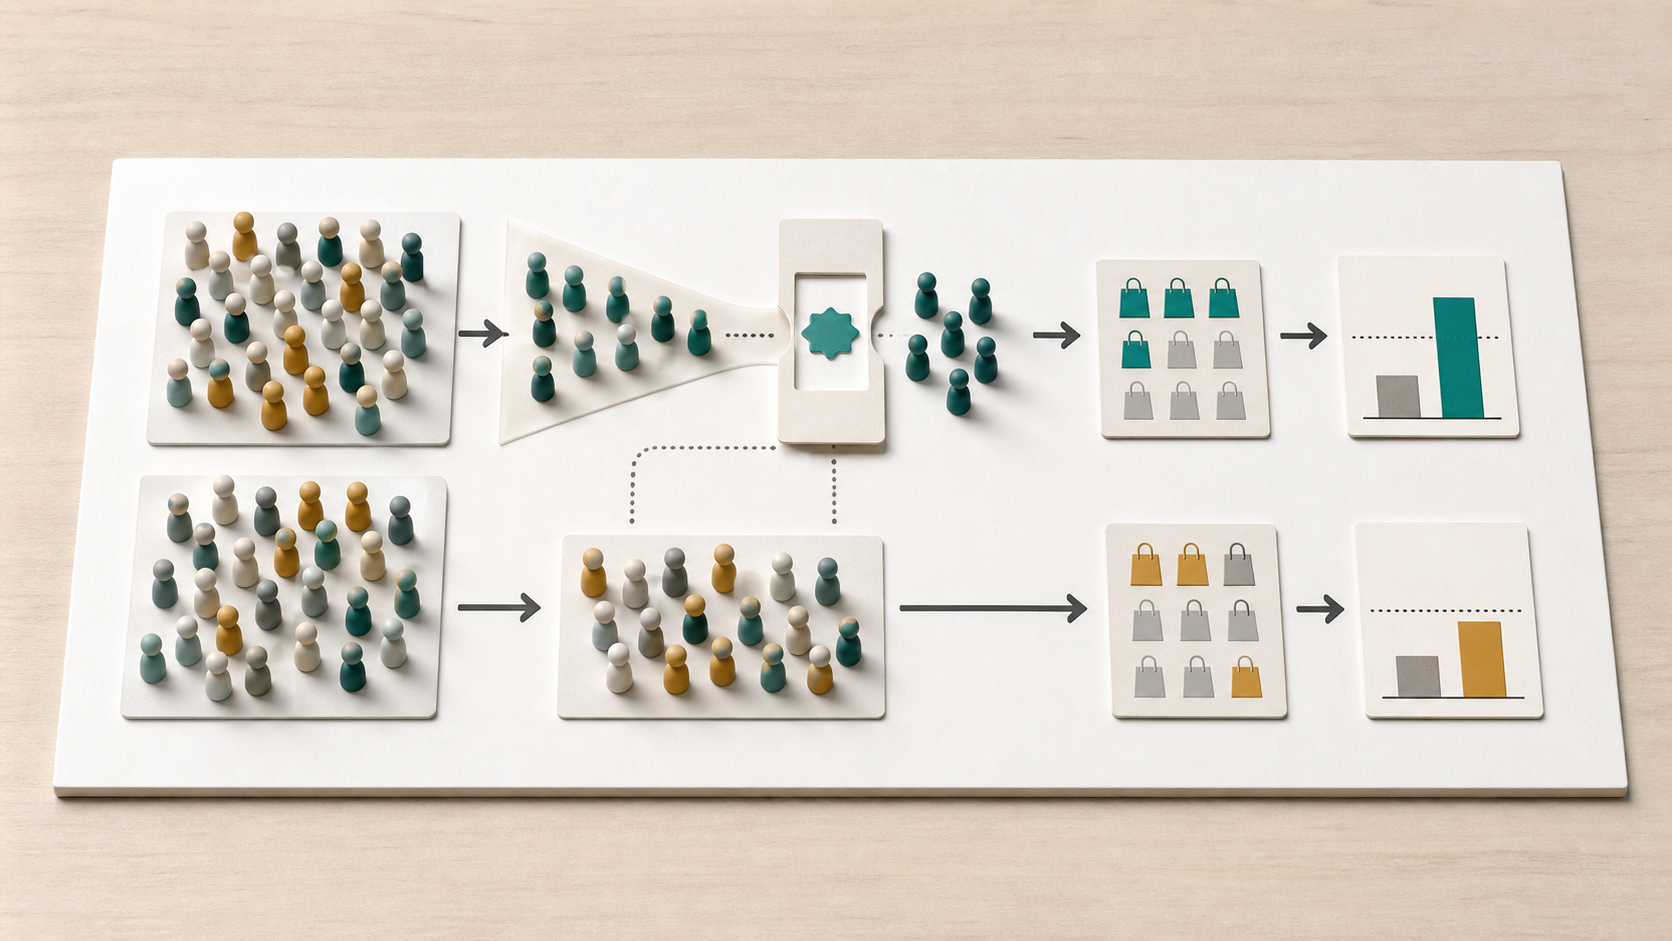
Archetype: Local cash-back marketplace where users claim an offer before visiting a retailer
Bias mechanism: The test group had to claim an offer before buying, while the control group did not complete an equivalent intent-revealing step. Claiming the offer is partly a measure of pre-existing purchase intent.
Business model pressure
Retailers pay for traffic, sales, store visits, or tracked transactions from cash-back users who claim offers before transacting. The channel can be useful, but the advertiser needs to know whether the offer changed behavior or mostly recorded shoppers who had already raised their hands.
Advertiser proof claim
The campaign report can show much higher purchase rates among offer claimers than among non-claimers. The counterfactual question is whether claim-eligible users who did not see or claim the offer would have purchased at similar rates once prior intent, distance, loyalty, category interest, and deal-seeking behavior are balanced.
Statistical result
| Metric | Naive read | Stratified read | Modeled benchmark |
|---|---|---|---|
| Purchase-rate lift | 26.0 pts | 2.0 pts | 1.0 pts |
| Attributed incremental purchases | 13,029 | 1,000 | 502 |
| Attributed transaction value | $938,104 | $71,977 | $36,132 |
| Transaction value after media cost | 4.47x | 0.34x | 0.17x |
The claimer-versus-non-claimer dashboard is 13.0x larger than the claim-eligible estimate in this worked example.
Readout audit questions
Use this pass before the case becomes a budget argument, buyer proof point, or channel lesson. The goal is to separate what the dashboard observed from what the campaign plausibly changed.
| Check | Question to ask | Evidence in this case | Safer claim boundary |
|---|---|---|---|
| Credited outcome | What is the report counting as campaign impact? | Separate attributed outcomes from incremental outcomes. In this case, the naive lift is 26.0 pts while the stratified read is 2.0 pts. | Treat path, click, form, survey, or matched-outcome reporting as descriptive until the counterfactual is visible. |
| Comparison group | Were treatment and control groups comparable before the campaign? | The test group had to claim an offer before buying, while the control group did not complete an equivalent intent-revealing step. Claiming the offer is partly a measure of pre-existing purchase intent. | Ask for a protected holdout, balanced market, suppression test, or matched comparison before using causal verbs. |
| Budget threshold | Would the decision survive the adjusted read? | The naive read is 13.0x larger than the stratified estimate, and adjusted ROAS is 0.34x after media cost. | Use the result for diagnosis, repair, or test planning unless the adjusted evidence clears the decision threshold. |
| Next evidence | What would change the conclusion? | Audit whether the measured group revealed stronger intent before the campaign could cause an outcome. | Name the missing evidence request before turning one worked example into a general rule. |
For the next review, pair this case with Audience selection bias checklist and the claim confidence rubric.
Claim-eligible decision logic
Before this case becomes proof that the offer created sales, read the result through the claim step. The useful question is whether comparable claim-eligible shoppers without the offer would have bought differently.
| Review point | Evidence to request | Decision consequence |
|---|---|---|
| Eligibility file | The full claim-eligible audience, offer-ranking rules, location or store-radius logic, loyalty status, category history, prior visits, and whether every eligible shopper had the same opportunity to see the offer. | If the report compares claimers with broad non-claimers, describe the result as claimer response rather than incremental merchant lift. |
| Claim-step balance | Claim rate, time from claim to purchase, prior store visits, basket history, deal-seeking frequency, and whether claimers had stronger intent before any measured exposure. | If claiming itself selects high-intent shoppers, remove causal lift and ROAS language until the claim-eligible comparison is balanced. |
| Exposure versus activation | Separate records for offer availability, offer view, offer claim, store visit, purchase, reward cost, and transaction matching. | If the same event both defines treatment and predicts purchase, treat the result as engagement-contaminated. |
| Outcome accounting | Net transaction value after reward cost, new-versus-returning shopper split, purchase window, refund handling, and whether normal repeat buying is included. | If the outcome is gross matched purchases among claimers, call it tracked claimer spend rather than incremental revenue. |
| Repair path | Randomized offer availability inside the eligible audience, a protected holdout, locked claim windows, pre-period balance reporting, and a prewritten claim boundary. | If renewal budget depends on incrementality, require the repair path before treating the cash-back result as sales lift proof. |
Worked downgrade
The headline version of this case says cash-back claimers produced a 26.0 point purchase-rate lift, 13,029 incremental purchases, and $938,104 in attributed transaction value. That version sounds budget-ready because the purchase is real and the offer claim creates a clean-looking path from incentive to sale.
The weaker read appears when the claim log shows that claimers were more likely to have recent category interest, stronger store proximity, loyalty behavior, and deal-seeking patterns before the offer could change demand. After comparing shoppers within similar offer-propensity strata, the estimated movement falls to 2.0 points and $71,977 in attributed value against $210,000 of media cost. The modeled benchmark is 1.0 point.
The safer readout sentence is: cash-back offer claimers bought at a higher rate, but the evidence does not prove incremental merchant demand because the claim step selected shoppers with stronger prior intent. The next action is to rerun with randomized offer availability among claim-eligible users, separate claim-rate reporting, and a protected holdout before using ROAS or sales-lift language.
The advertiser-facing story
The campaign appears strong because the report begins with people who actively claimed an offer and then ties those claimers to tracked purchases. The claim action feels like proof of campaign engagement, and the purchase match feels close enough to revenue that the dashboard can look more decisive than a click or visit report.
What broke
The act of claiming is not only a treatment step. It is also a signal that the shopper had enough category need, store access, deal interest, or purchase timing to take action before the campaign could plausibly cause the transaction. If the control group does not pass through an equivalent eligibility and claim-opportunity path, engagement becomes a disguised confounder.
Better design
Randomize offer availability before the claim step, compare claim-eligible users rather than claimers, and separately report offer availability, claim rate, store visit, purchase, reward cost, and incremental purchase effects. The clean readout starts with a fair opportunity to claim, not only with people who already claimed.
Propensity-strata audit
The adjusted estimate compares claimers and comparison shoppers within similar offer-propensity strata. That does not replace randomized offer availability, but it shows how much of the headline purchase gap was carried by people who had already shown stronger deal-seeking or store-visit intent.
| Propensity stratum | Claim-eligible shopper records | Claimer purchase rate | Claim-eligible comparison purchase rate | Within-stratum difference |
|---|---|---|---|---|
| 1 | 2,750 | 6.1% | 6.4% | -0.3 pts |
| 2 | 16,827 | 9.4% | 9.1% | 0.3 pts |
| 3 | 10,744 | 14.3% | 13.5% | 0.8 pts |
| 4 | 3,375 | 19.4% | 18.5% | 0.9 pts |
| 5 | 951 | 22.9% | 20.9% | 2.0 pts |
| 6 | 2,253 | 33.0% | 31.3% | 1.7 pts |
| 7 | 8,593 | 42.2% | 40.1% | 2.1 pts |
| 8 | 19,724 | 49.5% | 47.5% | 2.0 pts |
| 9 | 22,540 | 60.8% | 56.7% | 4.1 pts |
| 10 | 2,243 | 71.0% | 68.2% | 2.8 pts |
Takeaway
A strong cash-back offer readout should not stop at the purchase rate of people who claimed the offer. It should show who was eligible, who had a fair chance to claim, how claim behavior was separated from exposure, whether pre-period intent was balanced, and how much of the result survives a protected claim-eligible counterfactual.
Move from this case to the next review.
Use the case to tighten claim language, choose a better measurement method, and review the next campaign readout without treating a worked example as a rule.