Geo lift testing
The Geo Lift Test That Mistook Seasonal Markets For Media Lift
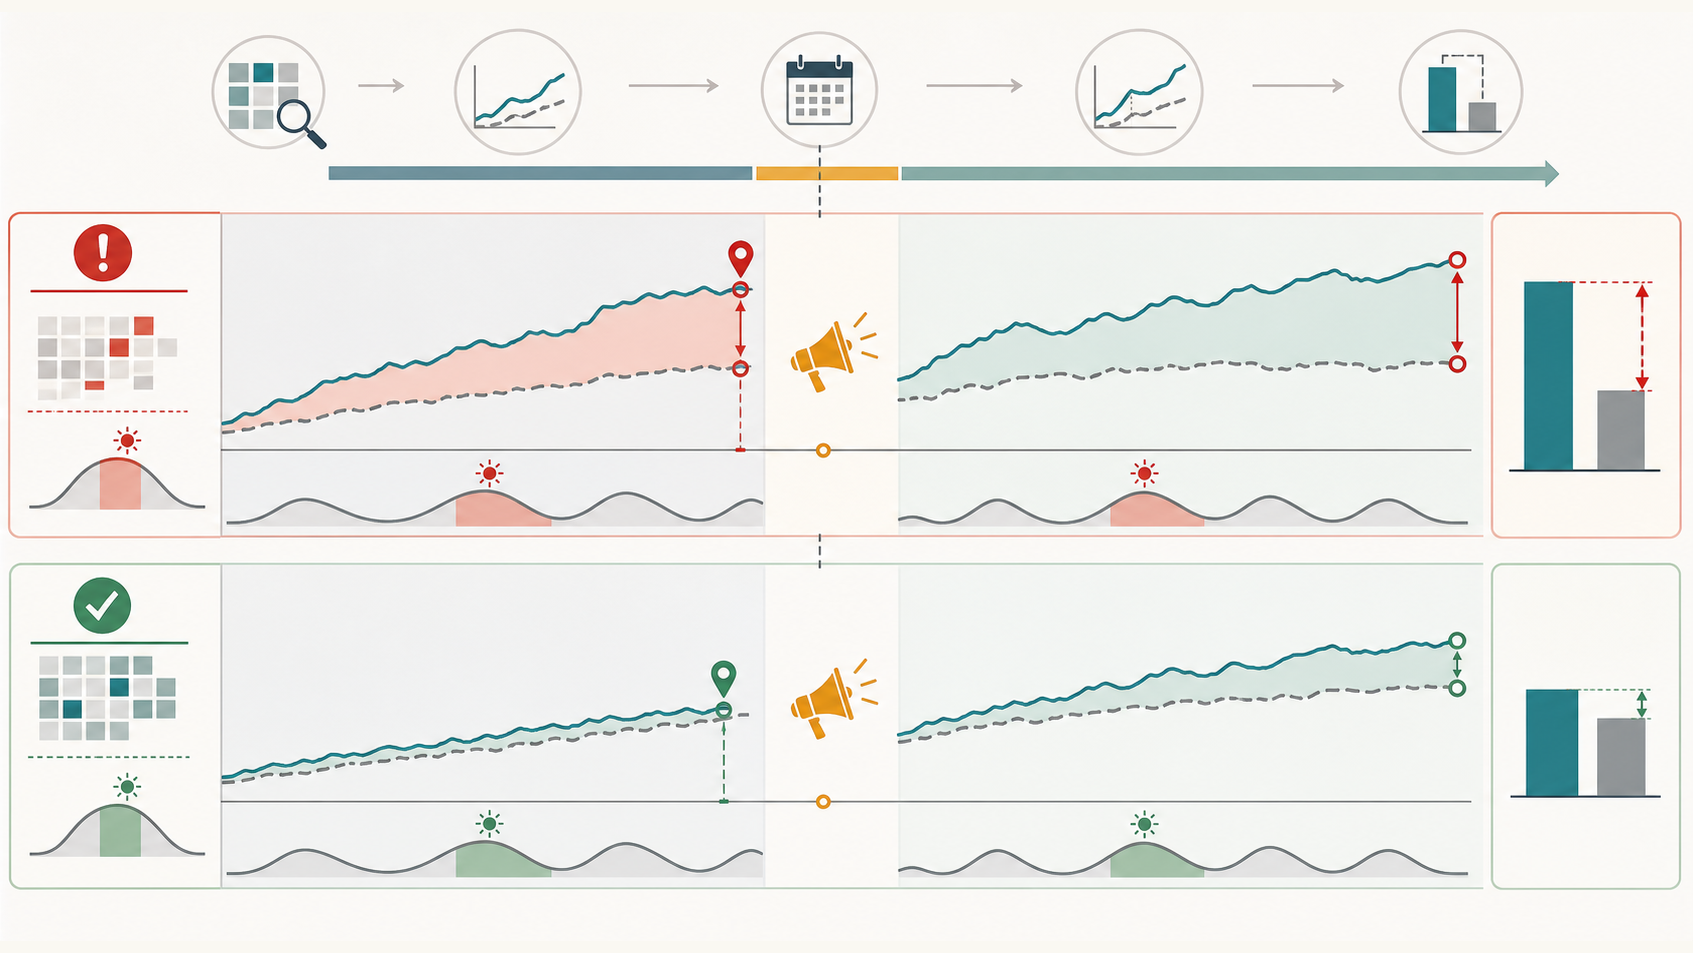
A realistic geo-lift measurement scenario showing how selected markets with stronger baseline momentum and seasonal timing can turn a post-launch gap into an overstated incrementality and ROAS claim.
Archetype: Matched-market geo lift campaign with uneven pre-period demand
Bias mechanism: The treated markets already had stronger category momentum, higher baseline demand, and more favorable timing before the campaign, so the readout treats market selection and seasonality as incremental media impact.
Business model pressure
A regional media campaign earns budget by showing that activated markets produced more sales than comparison markets. The buyer needs to know whether the campaign changed demand, not only whether the chosen markets were already on a better path.
Advertiser proof claim
A readout reports higher sales, stronger ROAS, and a clean-looking lift percentage in exposed markets, but the counterfactual question is whether similar markets with the same pre-period trajectory would have grown without the extra media.
Statistical result
| Metric | Naive read | Stratified read | Modeled benchmark |
|---|---|---|---|
| Sales-rate lift | 20.0 pts | 1.2 pts | 0.9 pts |
| Attributed incremental sales | 16,339 | 949 | 736 |
| Attributed sales value | $1,094,721 | $63,558 | $49,283 |
| Attributed value after media cost | 1.30x | 0.08x | 0.06x |
The market-gap readout is 17.2x larger than the pre-period-balanced estimate in this worked example.
Readout audit questions
Use this pass before the case becomes a budget argument, buyer proof point, or channel lesson. The goal is to separate what the dashboard observed from what the campaign plausibly changed.
| Check | Question to ask | Evidence in this case | Safer claim boundary |
|---|---|---|---|
| Credited outcome | What is the report counting as campaign impact? | Separate attributed outcomes from incremental outcomes. In this case, the naive lift is 20.0 pts while the stratified read is 1.2 pts. | Treat path, click, form, survey, or matched-outcome reporting as descriptive until the counterfactual is visible. |
| Comparison group | Were treatment and control groups comparable before the campaign? | The treated markets already had stronger category momentum, higher baseline demand, and more favorable timing before the campaign, so the readout treats market selection and seasonality as incremental media impact. | Ask for a protected holdout, balanced market, suppression test, or matched comparison before using causal verbs. |
| Budget threshold | Would the decision survive the adjusted read? | The naive read is 17.2x larger than the stratified estimate, and adjusted ROAS is 0.08x after media cost. | Use the result for diagnosis, repair, or test planning unless the adjusted evidence clears the decision threshold. |
| Next evidence | What would change the conclusion? | Balance pre-period trend, seasonality, market exclusions, and alternate comparison sets. | Name the missing evidence request before turning one worked example into a general rule. |
For the next review, pair this case with Geo lift test design checklist and the claim confidence rubric.
Market-balance decision logic
Before this case becomes proof that regional media created demand, read the result through the market-selection record. The useful question is whether comparable markets with similar pre-period momentum would have grown without the extra media.
| Review point | Evidence to request | Decision consequence |
|---|---|---|
| Candidate-market universe | The complete list of eligible markets before launch, including excluded markets, market-size thresholds, distribution constraints, and any sales-team or operations overrides. | If the readout starts only with activated markets, describe the result as a selected-market performance gap rather than geo lift. |
| Pre-period trend fit | Weekly or daily baseline sales, category demand, prior campaign pressure, organic growth, store coverage, and product availability for activated and comparison markets before launch. | If activated markets were already climbing faster, remove causal lift and ROAS wording until the comparison set is rebalanced. |
| Seasonality and event overlap | Local holidays, weather, retail calendars, category peaks, promotion windows, competitive events, and distribution changes that overlap the campaign window. | If the campaign starts into a favorable seasonal window for treated markets, downgrade the claim to timing-sensitive response unless sensitivity checks hold. |
| Holdout protection | A predeclared comparison-market plan, randomized or matched holdouts where possible, frozen market exclusions, leakage checks, and rules for replacing unusable markets. | If controls were rebuilt after seeing results, treat the readout as diagnostic and require a new test before budget-renewal proof language. |
| Claim boundary | A written ladder separating market coverage, observed sales gap, trend-adjusted response, and randomized or predeclared geo incrementality. | If renewal depends on causal proof, require pre-period-balanced markets, alternate control sets, and mature post-period checks before using lift or ROAS language. |
Worked downgrade
The headline version of this case says the regional campaign produced a 20.0 point sales-rate lift, 16,339 attributed incremental sales, and $1,094,721 in attributed sales value. That version sounds usable because the campaign launched in markets that mattered and the post-launch chart shows a large gap.
The weaker read appears when the market file shows that activated regions already had stronger baseline demand, cleaner distribution, favorable seasonal timing, and category momentum before launch. After comparing market-audience cells within similar pre-period propensity strata, the estimated movement falls to 1.2 points and $63,558 in attributed value against $840,000 of media cost. The modeled benchmark is 0.9 points.
The safer readout sentence is: activated markets outperformed comparison markets during the campaign window, but the evidence does not prove incremental demand because the market plan selected regions that were already on a stronger seasonal path. The next action is to rerun with predeclared comparison markets, trend-balance diagnostics, frozen exclusions, event calendars, and sensitivity checks before using lift or ROAS language.
The advertiser-facing story
The campaign appears to work because activated markets outpace comparison markets during the readout window. A clean chart shows a post-launch gap, the bar chart converts the gap into incremental sales, and the budget story sounds plausible because the markets receiving media were also commercially important.
What broke
The activated markets were not exchangeable with the comparison markets. They had stronger pre-period growth, better category conditions, cleaner distribution, or more favorable seasonal timing before media pressure increased. A post-period gap can therefore measure market choice, launch timing, and operational readiness as much as media effect.
Better design
Choose comparison markets before launch, balance pre-period levels and trends, document excluded markets, keep promotion and distribution changes visible, and run sensitivity checks against alternate matched controls. A useful readout should show whether the conclusion survives a better baseline and whether the decision changes when high-momentum markets are removed from the headline estimate.
Propensity-strata audit
The adjusted estimate compares treated and comparison observations within similar pre-period propensity strata. That does not replace a randomized geo holdout, but it shows how much of the naive result was carried by which markets entered treatment.
| Propensity stratum | Market-audience cells | Activated-market sales rate | Comparison-market sales rate | Within-stratum difference |
|---|---|---|---|---|
| 2 | 5,158 | 8.3% | 6.5% | 1.8 pts |
| 3 | 14,864 | 10.2% | 9.8% | 0.4 pts |
| 4 | 15,209 | 14.3% | 12.8% | 1.5 pts |
| 5 | 10,222 | 17.6% | 17.1% | 0.5 pts |
| 6 | 7,147 | 24.2% | 23.5% | 0.6 pts |
| 7 | 11,516 | 36.7% | 35.1% | 1.6 pts |
| 8 | 25,600 | 45.4% | 44.5% | 1.0 pts |
| 9 | 35,921 | 56.4% | 55.5% | 1.0 pts |
| 10 | 6,363 | 68.0% | 63.4% | 4.6 pts |
Takeaway
A strong geo-lift readout should not stop at a post-launch market gap. It should show how markets were selected, whether pre-period trends were balanced, which operational changes overlapped the campaign, and how much of the result survives alternate comparison sets.
Move from this case to the next review.
Use the case to tighten claim language, choose a better measurement method, and review the next campaign readout without treating a worked example as a rule.