Campaign measurement
Reach and frequency measurement checklist
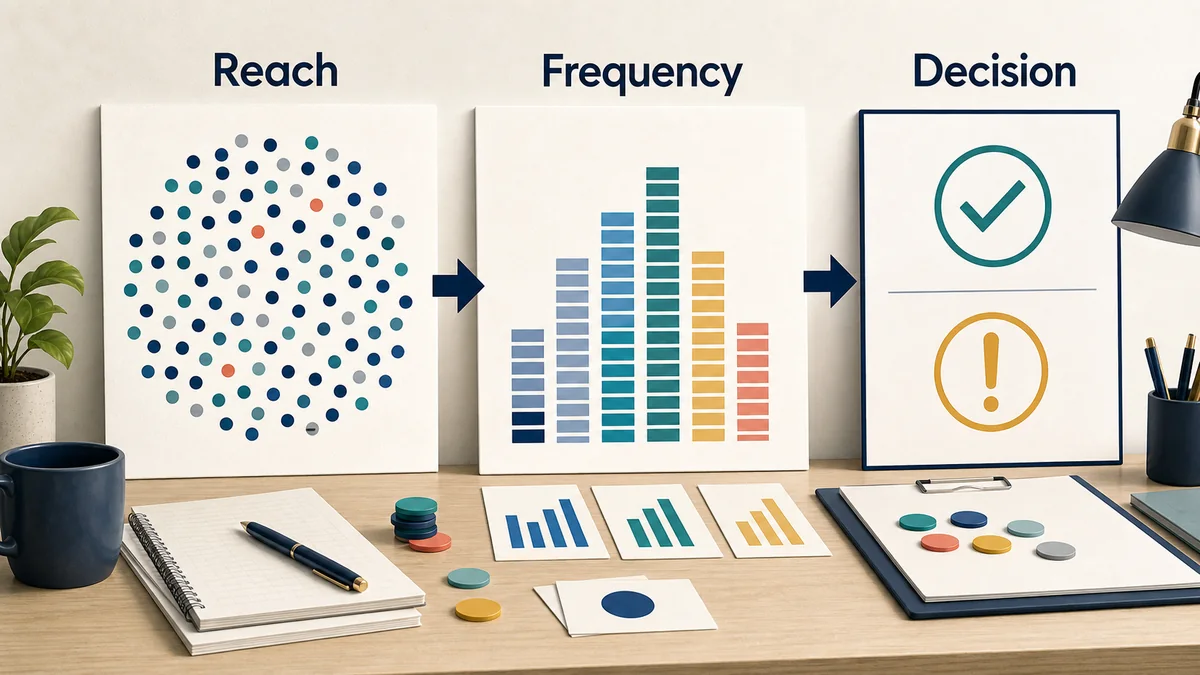
Reach and frequency look simple until the report has to say who was reached, how often, and whether repeated exposure helped or just concentrated delivery on the easiest people to find.
Use this checklist before reading a programmatic, CTV, sponsorship, retail media, social, or direct-sold campaign report. It keeps device counts, household counts, modeled people, identity matches, frequency caps, and outcome claims in separate lanes.
Picture a renewal meeting where the headline says the campaign reached 42% of the target audience at 4.8 average frequency. That sentence sounds complete, but it still hides the counted unit, the matched universe, the high-frequency tail, cap exceptions, and whether the response came from broad reach or a small group that saw the ad many times.
Start with the unit of reach
A reach number is only useful after the counted unit is clear. One campaign can have several valid reach figures that should not be averaged together.
| Reach unit | What it can show | What can distort it |
|---|---|---|
| Device or browser | How many distinct technical identifiers received delivery. | Shared devices, deleted identifiers, cross-device duplication, and unmeasured environments. |
| Household | How many modeled homes, accounts, or addresses were eligible for exposure. | Co-viewing, household composition, identity graph coverage, and duplicated devices inside a home. |
| Logged-in account | How many known accounts were reached inside a platform or publisher system. | Multiple users per account, inactive accounts, partial login coverage, and missing off-platform exposure. |
| Modeled person | An estimated count of people reached after identity stitching or panel adjustment. | Model assumptions, confidence thresholds, panel bias, and hidden unmatched records. |
| Customer or prospect list | Delivery against a matched advertiser, retailer, or CRM universe. | Match-rate selection, stale records, duplicate customers, and exclusion of unmatched people. |
Pre-flight controls
1. Define eligible reachName the audience, geography, content context, placement group, device classes, frequency cap, and exclusion rules that count as qualified delivery. A broad reach figure can hide missed delivery in the context that mattered.
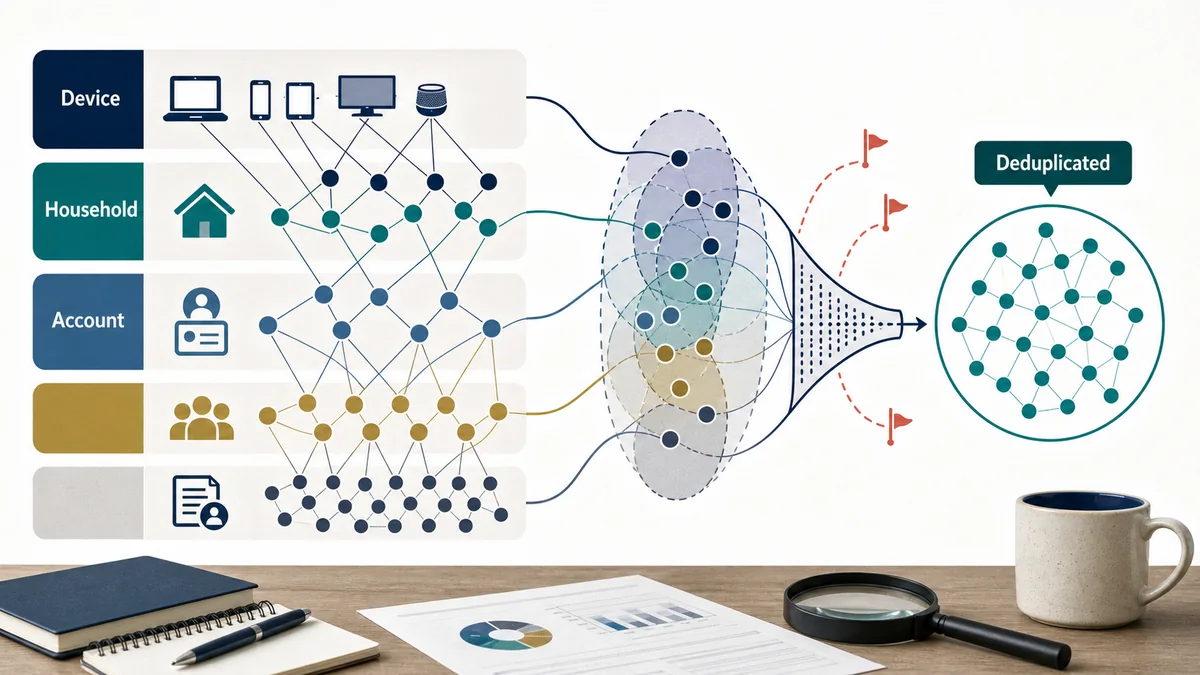
2. Lock the identity hierarchyDecide whether the readout will use device, household, account, modeled person, customer, or site-session reach. If several units are needed, label each one and do not blend them into one denominator.
3. Require deduplication notesAsk how the report handles duplicate identifiers, shared devices, multiple household members, unlogged users, clean-room overlap, and suppressed cells. Deduplication should be described before performance is interpreted.
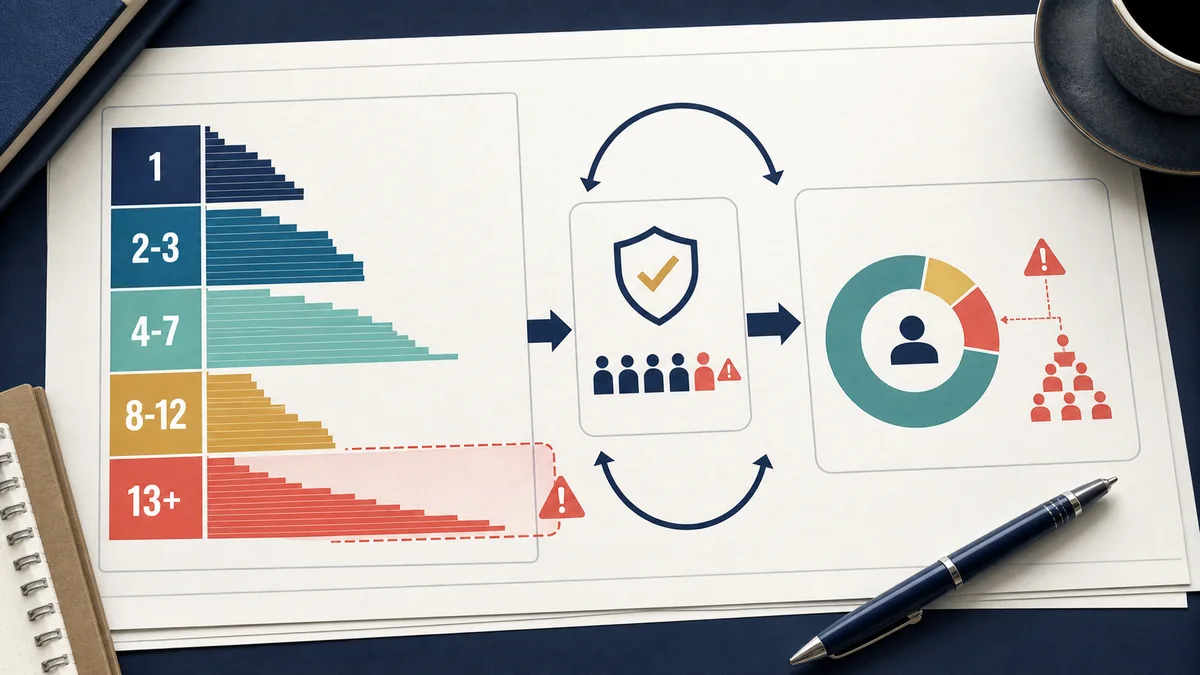
4. Set frequency bands before launchUse bands such as 1, 2-3, 4-7, 8-12, and 13+ exposures, or another pre-set structure that matches the campaign. Averages alone hide high-frequency tails.
5. Decide the cap ruleState whether the cap is daily, weekly, lifetime, per device, per household, per account, or per deal. A cap that only applies inside one buying path may not control total exposure.
Report QA table
| Check | What the report should show | Why it matters |
|---|---|---|
| Reach denominator | The eligible universe, matched universe, measured universe, and reached universe. | Reach percentage changes depending on which universe is used as the base. |
| Deduplicated reach | Reach by placement, device, content context, and buying path before and after deduplication where available. | A campaign can look larger when the same person or household is counted several times. |
| Frequency distribution | Average frequency, median frequency, frequency bands, and the share of impressions in the highest bands. | A small overexposed group can absorb budget and drive noisy outcomes. |
| Cap delivery | Configured cap, actual cap adherence, exceptions, pacing changes, and paths outside the cap. | A reported cap does little if other placements, partners, or devices continue delivery. |
| Outcome concentration | Clicks, visits, leads, conversions, or survey completes by frequency band. | High-frequency responders may be higher intent, easier to identify, or already closer to action. |
| Incremental reach | New reach versus overlap with prior campaigns, other channels, publisher packages, or audience lists. | A buy can add impressions without adding many new people or households. |
Interpret frequency carefully
Frequency can support memory, waste budget, or reveal selection. The report should not assume repeated exposure caused the outcome unless the comparison design can support that claim.
| Pattern | Possible read | Question to ask before acting |
|---|---|---|
| Low reach, high average frequency. | The campaign repeatedly found a narrow audience. | Was the objective depth in a small group or broader qualified reach? |
| High clicks at high frequency. | Repeated exposure may be selecting the people most likely to respond. | Did lower-frequency or withheld groups provide a fair comparison? |
| Strong reach, weak downstream action. | The campaign delivered broadly but may have missed message, offer, or audience quality. | Were exposure quality and landing-page quality strong enough to judge the audience? |
| High household reach, low person confidence. | The campaign may have reached homes more clearly than individuals. | Does the decision require household delivery, individual persuasion, or account-level action? |
| Incremental reach is small. | The package may be overlapping with existing media or retargeting pools. | Can buying paths, context, or exclusions be changed to add unduplicated reach? |
Decision map
Use the pattern in the reach and frequency evidence to choose the next action. The goal is not to make every report sound positive; it is to make the recommendation match the counted unit, distribution, and comparison strength.
| Readout pattern | What it usually means | Best next action | Careful decision language |
|---|---|---|---|
| Broad deduplicated reach, healthy distribution, and no heavy tail. | The campaign reached the intended universe without overconcentrating delivery. | Renew or scale carefully, while preserving the same unit and cap rules. | The campaign delivered broad measured reach under the stated identity definition and frequency controls. |
| Low reach and high average frequency. | Delivery repeatedly found a narrow group, audience pool, placement path, or retargeting pocket. | Revise the audience, context, exclusions, pacing, or buying path before increasing budget. | The campaign created concentrated exposure, not broad reach. |
| High reach with weak downstream response. | The audience may have been broad, but message, offer, destination, or exposure quality needs review. | Retest creative, destination, or quality gates before judging audience fit. | The campaign reached the measured audience, but the response evidence does not yet support a stronger performance claim. |
| Household reach is clear, but person-level confidence is weak. | The campaign may support a household-delivery claim better than an individual-persuasion claim. | Hold person-level language or add a design that can support it. | The readout is strongest as household reach evidence and weaker as person-level exposure evidence. |
| Observed outcomes cluster in the highest frequency band. | Repeated exposure may be selecting high-intent people or already-active customers. | Use a holdout, matched comparison, or frequency-specific test before claiming lift. | Outcomes were concentrated among high-frequency exposed users; incremental impact remains unproven. |

Readout language
| If the evidence shows | Cleaner wording | Overclaim to avoid |
|---|---|---|
| High deduplicated reach and no outcome test. | The campaign reached a broad measured audience under the stated identity definition. | The campaign created incremental demand. |
| Average frequency was on plan, but the tail was heavy. | Average frequency met plan, while a high-frequency segment received concentrated delivery. | The cap worked for the full audience. |
| High-frequency users converted more often. | Observed conversions were concentrated among high-frequency exposed users; causal confidence depends on the comparison. | More frequency caused the conversions. |
| Household reach is stronger than device reach. | The report is strongest as household delivery evidence and weaker as person-level exposure evidence. | The campaign reached the same number of people. |
| Overlap with prior media is high. | The buy added limited incremental reach against the available overlap check. | The campaign was inefficient in every context. |
Common failure modes
- Comparing reach from device-level reporting with reach from household or modeled-person reporting.
- Reporting average frequency without the distribution or high-frequency share.
- Calling repeated exposure a cause of conversion when high-intent people were easier to find repeatedly.
- Treating a platform frequency cap as total campaign frequency across all partners and devices.
- Ignoring unmatched records when reach is calculated from a customer list, clean room, or identity graph.
- Using total impressions as proof that the campaign added new people rather than more touches to the same people.
Pair with
Use this checklist with the campaign KPI dictionary for metric definitions, the viewability and invalid traffic checklist for exposure-quality gates, the CTV and video checklist for household and completion reporting, the identity matchback checklist for matched outcomes, and the incrementality test plan template when the decision needs a causal estimate.