Trend framing
Before-and-after chart and trend claim checklist
Organization byline: Measurement Press editorial desk. This page does not list an individual author or reviewer. Read the editorial method and corrections policy.
About 11 min read
A before-and-after chart can be accurate and still make the wrong comparison feel obvious.
Use this checklist when a story, dashboard, campaign report, research deck, or public-data chart points to a jump, drop, record high, sudden turn, or post-launch change. The goal is to separate a real movement in the data from a causal story the chart has not earned.
Picture a renewal meeting where the first slide shows a metric before launch and the same metric after launch. The line is higher, the headline says the campaign drove the gain, and nobody has yet shown the longer history, the starting base, or what else moved during the same weeks. The chart may be useful, but it is not yet proof.
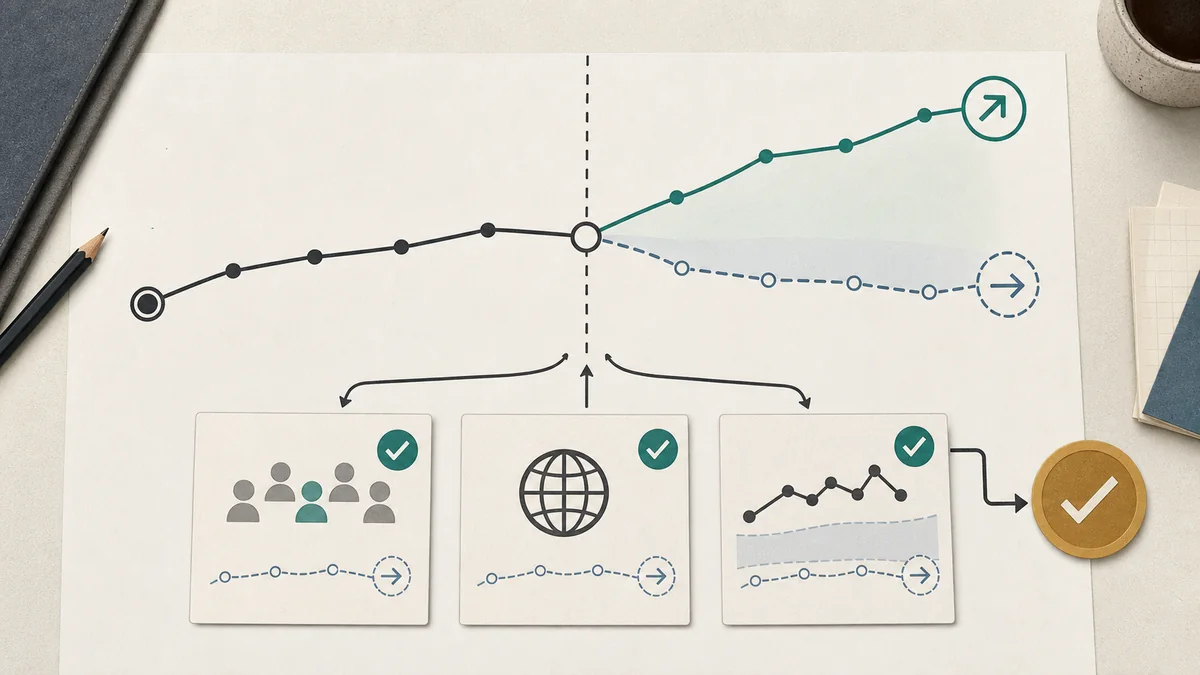
The first move is to make the hidden comparison visible. A short before-and-after view answers "what changed?" A decision-grade review also asks "compared with what?" and "what would we have expected without the event?"

Start with the chart's claim
Do not start by debating the design. First name the sentence the chart is asking the reader to believe.
| Chart move | Question to ask | Careful first read |
|---|---|---|
| Before and after a launch | What else changed at the same time, and what would have happened without the launch? | The chart shows timing, not yet cause. |
| Sharp jump or drop | Is the movement a level shift, a return to normal, a data-definition change, or noise from a small base? | The movement needs a longer baseline and a denominator. |
| Record high or low | How long is the record, how volatile is the series, and was the comparison window chosen after the result? | A record can be meaningful or just a feature of a short or noisy series. |
| Percent change headline | What were the starting level, eligible population, and absolute change? | A large percentage from a small base can be directionally true but decision-poor. |
| Campaign-period improvement | Was there a holdout, matched market, model baseline, or preselected comparison? | Observed lift is not incremental lift until the counterfactual is visible. |
| Seasonal pattern | Does the chart compare the same season, same weekday mix, and same calendar effects? | The chart may be showing seasonality rather than a new effect. |
Minimum source packet
Before accepting the trend language, ask for enough material to reproduce the chart and understand its limits.
Original seriesThe table, report, dashboard export, or public record closest to the plotted number, not only a screenshot or executive summary.
Definition notesThe numerator, denominator, eligibility rules, inclusion rules, missing population, revisions, and any method change during the charted period.
Full windowEnough pre-period and post-period data to see trend, volatility, seasonality, and whether the shown window was selected because it looked persuasive.
Event timelineLaunches, pricing changes, outages, news events, sales coverage changes, inventory shifts, data backfills, and concurrent campaigns that could explain the movement.
Comparison ruleThe prior period, peer group, matched market, holdout, forecast, model baseline, or explicit statement that no credible comparison exists.
Uncertainty and stabilityConfidence intervals, sensitivity ranges, sample sizes, minimum cell thresholds, revision history, or simple volatility checks when formal uncertainty is unavailable.

Trend-framing checks
| Check | Raise confidence when | Lower confidence when |
|---|---|---|
| Window choice | The chart shows a preselected window or enough history to judge whether the movement is unusual. | The start date is placed at a convenient trough or peak. |
| Scale and axis | The axis, baseline, and units make the size of the change clear. | A truncated scale makes a modest change look dramatic, or a wide scale hides a material shift. |
| Denominator | Counts are paired with eligible population, rate base, or starting level. | The claim relies on percent change without showing the base. |
| Comparability | Definitions, data collection, geography, audience, and inclusion rules are stable across the period. | The series changes method in the middle of the story. |
| Seasonality | The comparison controls for recurring calendar patterns, weekday mix, holidays, or sales cycles. | A busy season is compared with a quiet season as if the campaign or story event caused the gap. |
| Counterfactual | A holdout, matched market, peer series, forecast, or model baseline was chosen before the result was known. | The chart compares only before with after and calls the difference impact. |
| Revision risk | The source states whether numbers are final, preliminary, backfilled, estimated, or subject to restatement. | The chart treats a first release or partial record as settled truth. |
Decision map for trend claims
Use the evidence state to choose the claim strength. The goal is not to reject every chart; it is to keep the wording inside the support the chart actually provides.
| Evidence state | Decision use | Question that decides the next step | Wording ceiling |
|---|---|---|---|
| Only a clipped before-and-after view. | Use for a question, not a conclusion. | What does the longer baseline show? | "The shown values changed." |
| Full series with stable definitions, but no comparison. | Use for descriptive trend reading. | Could seasonality, regression to normal, or concurrent events explain the move? | "The post-event period differs from the prior pattern." |
| Full series plus denominator, source notes, and event timeline. | Use for stronger diagnosis and follow-up requests. | Which non-campaign or non-event explanations remain plausible? | "The timing is consistent with the event, with these limits." |
| Preselected peer, matched market, forecast, or holdout. | Use for directional impact language when the match is credible. | Was the comparison chosen before the outcome was known? | "The change is stronger than the comparison under this design." |
| Randomized or well-controlled design with sensitivity checks. | Use for bounded causal claims. | Does the design answer this decision, audience, window, and outcome? | "The design estimates incremental effect for this scope." |
Before and after is not a counterfactual
The main weakness in before-and-after reasoning is not that the after period changed. It is that the chart does not show what the after period would have looked like without the event.
| Evidence available | Supportable wording | Do not say yet |
|---|---|---|
| Only before and after values. | "The metric changed after the event." | "The event caused the change." |
| Longer trend without comparison group. | "The post-event period differs from the prior trend, subject to other changes in the period." | "The full difference is incremental impact." |
| Matched peer, market, or segment. | "The change is directionally stronger than a defined comparison, with matching limits." | "This is equivalent to randomized evidence." |
| Designed holdout or randomized test. | "The design estimates incremental effect for this audience, window, and outcome." | "The same effect will apply everywhere." |
| Model baseline calibrated with tests. | "Multiple evidence streams support the direction within stated assumptions." | "The model has proven exact contribution." |
Primary source trail and a simulated comparison
The U.S. Census Bureau's X-13ARIMA-SEATS reference and seasonal-adjustment guidance says time-series values need consistent concepts and measurement methods to be comparable, and explains that seasonal and calendar effects can obscure the direction of a series. Seasonal adjustment can make neighboring values easier to compare, but it does not remove abnormal shocks, so a two-point movement still needs context and a longer baseline.
For campaign claims, Google's Conversion Lift documentation describes treatment and control groups whose difference is used to estimate incremental conversions. Google's campaign experiment definition describes running an experiment alongside the original campaign for a specified period. Those designs are stronger than a simple before-and-after because they introduce a comparison, but they still require a defined outcome, eligible population, timing, and method; a chart's temporal order alone is not a lift study.
Timing can also change the result being counted. Google's conversion-window guidance notes that conversions are counted within the selected window and that changing windows affects future reporting rather than retroactively adding conversions outside the prior window. Treat the outcome window as part of the claim, not a footnote.
Simulated worked example - not a live campaign or published dataset: suppose a treated market moves from 800 qualified actions before a launch to 960 after it, while a preselected comparison market moves from 800 to 880 over the same dates. The raw treated change is 960 - 800 = 160 actions, or 20%. The comparison changed by 880 - 800 = 80 actions, or 10%. A simple difference-in-differences estimate is therefore 160 - 80 = 80 actions, which is 80 / 800 = 10% relative to the treated market's starting level.
| Calculation | Result | What it can support |
|---|---|---|
| Treated change: 960 - 800 | +160 actions (+20%) | The treated market improved during the shown window. |
| Comparison change: 880 - 800 | +80 actions (+10%) | Some movement also occurred without the launch in the comparison. |
| Difference in changes: 160 - 80 | +80 actions | The treated change exceeded the comparison by 80 actions under the design. |
| Normalized estimate: 80 / 800 | +10% | A bounded incremental estimate, not proof that every extra action came from the launch. |
Assumptions and limits: this illustrative calculation assumes the comparison would have followed the treated market's counterfactual trend, definitions and eligibility stayed stable, the markets were not exposed to one another's treatment, and the launch did not coincide with a different shock. It does not show uncertainty, statistical power, spillover, seasonality adjustment, conversion lag, or data revisions. In a real readout, test those assumptions and report the outcome window before using incremental or causal language.
Simulated trend-claim acceptance audit
Use the same fictional values above as a small packet review. This is a simulated worksheet, not a live delivery audit or a published dataset. A pass means the packet exposes the item; a hold means the evidence is missing and the claim must stay descriptive.
| Gate | Result | Reason and next action |
|---|---|---|
| Metric, eligibility, and denominator are fixed | PASS | Both markets use the stated qualified-action counts; preserve the definition in the readout. |
| Raw changes and normalization reproduce | PASS | 160 - 80 = 80 actions and 80 / 800 = 10%; retain the formula beside the claim. |
| Longer baseline and seasonal context are shown | HOLD | Two points per market cannot test trend shape or recurring timing; request the longer series and calendar notes. |
| Comparison design supports a counterfactual | HOLD | The example names a preselected comparison but supplies no pre-period parallel-trend check; do not call the estimate causal. |
| Outcome window and lag are stated | HOLD | No conversion or reporting window is supplied; state the window before comparing post-period actions. |
| Claim wording stays within the packet | PASS | ?80 more actions than the comparison change? is supportable; ?the launch caused 80 actions? is not. |
Worksheet result: 3 of 6 gates pass = 50.0%. The three holds control the decision: report the observed and comparison changes, but stop at a bounded descriptive statement until the baseline, design, and outcome window are supplied. Re-run the six rows whenever a denominator, date range, series definition, or comparison selection changes.
Common failure modes
Convenient start date
The chart starts at the low point or high point that makes the desired movement look largest.
Mixed definitions
The series changes eligibility, tracking method, geography, or inclusion rules while the chart presents one smooth line.
Seasonal comparison
A holiday, budget cycle, school year, sales period, or weekday mix explains more than the highlighted event.
Small-base drama
A large percentage change comes from a starting level too small to support the tone of the headline.
Concurrent shocks
Pricing, supply, news, promotion, sales coverage, inventory quality, or data backfill moves at the same time.
Attribution language
A descriptive line chart is promoted into a causal claim without a planned comparison.
Rewrite the claim
When the comparison is weak, the fix is usually a narrower sentence, not a louder chart. Keep the observed movement, remove the causal leap, and name the evidence that would justify stronger language later.

| Weak wording | Cleaner wording | Evidence needed to go stronger |
|---|---|---|
| "The campaign drove a 30% increase." | "Observed outcomes were 30% higher during the campaign period." | Holdout, matched market, or credible baseline chosen before launch. |
| "The issue is suddenly exploding." | "Reported counts rose in the shown window; the rate base and longer trend need checking." | Full record, denominator, method notes, and a longer comparison period. |
| "This change proves the new strategy worked." | "The post-launch period improved, but other concurrent changes must be separated." | Controlled rollout, staggered timing, or matched comparison group. |
| "The chart shows a historic collapse." | "The series reached a low in this record; volatility and record length matter." | Longer history, uncertainty, peer comparison, and definition stability. |
| "The new channel lifted sales." | "Sales rose after the channel launched under this attribution window." | Incrementality test, geo design, or calibrated model with sensitivity checks. |
Meeting questions
- What exact sentence does the chart want us to believe?
- What is the numerator, denominator, and starting level?
- Why does the chart start and end where it does?
- What else moved during the same period?
- What would the after period have looked like without the event?
- What comparison was chosen before results were visible?
- What weaker wording would still be true if the causal story were removed?
Pair with
For media claims, pair this checklist with the media claim audit worksheet, public records and denominator checklist, survey and poll claim checklist, and claim confidence rubric.
For advertising measurement, pair it with the campaign readout QA checklist, comparison market and holdout planning guide, geo lift test design checklist, MMM readout QA checklist, and incrementality test plan template.
For official references and citation workflow, use the source library before turning a chart into a public claim or budget recommendation.