Measurement uncertainty
Uncertainty interval readout checklist
Organization byline: Measurement Press editorial desk. This page does not list an individual author or reviewer. Read the editorial method and corrections policy.
About 12 min read
A point estimate is rarely the whole result. Poll margins, brand lift intervals, MMM ranges, and campaign lift readouts all need the same discipline: read the range of plausible values before deciding what the evidence can support.
Use this checklist when a report sounds precise but the decision depends on uncertainty: whether to scale spend, renew a package, call a brand study positive, compare two creatives, trust a poll movement, or translate a model result into budget language.
Start with the interval question
Do not ask only whether the estimate is positive. Ask what range of results remains plausible under the method, data, assumptions, and sample size.
| Readout element | Question to ask | Weak shortcut |
|---|---|---|
| Point estimate | What is the reported lift, difference, contribution, or share? | Reading the single number as the result. |
| Interval width | How wide is the confidence interval, credible interval, margin, or modeled range? | Calling a noisy estimate meaningful because it points in the desired direction. |
| Decision threshold | Does the whole plausible range clear the business, editorial, or measurement hurdle? | Treating a result as useful because it barely clears zero. |
| Outcome meaning | Is the interval attached to the outcome that matters, or only to a proxy? | Letting precise recall, attention, or click estimates stand in for sales or belief change. |
| Comparison unit | Are intervals shown for the actual unit being compared: users, markets, stores, placements, creatives, or weeks? | Ranking slices that have different sample sizes and no comparable uncertainty. |
Read the range before the headline
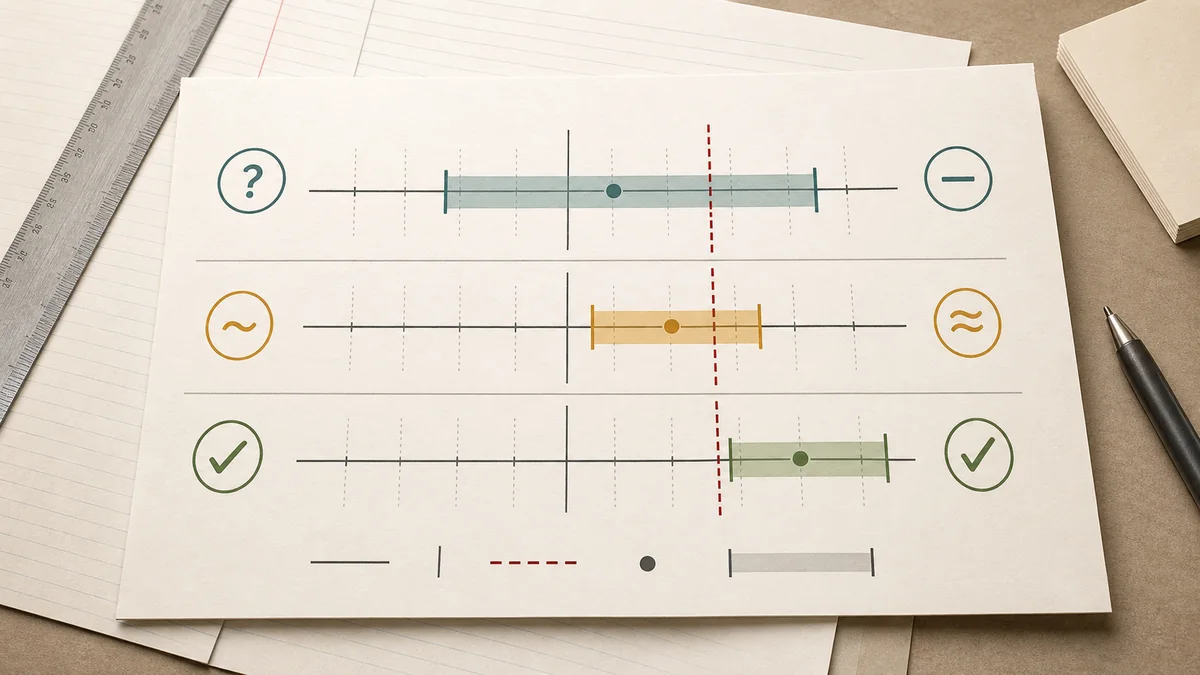
Positive point estimate, interval crosses zeroThe estimate is compatible with benefit, no effect, and possibly harm. The careful sentence is directional or inconclusive, not a firm win.
Narrow interval, wrong outcomeA precise proxy can still answer the wrong question. A tight recall interval does not prove sales lift; a tight click-through interval does not prove incremental demand.
Wide interval, large upsideA large point estimate with a wide range may justify learning or a better-powered test, but it should not become a confident forecast.
Interval clears the decision hurdleIf the whole credible range is above the prewritten threshold and the design fits the question, stronger action language becomes more defensible.
No interval shownThe reader should treat the estimate as incomplete. Ask for sample size, model uncertainty, design effect, variance method, or a clear reason the interval is unavailable.

Common readout traps
| Claim | What the interval may reveal | Cleaner wording |
|---|---|---|
| "The campaign lifted conversions by 8%." | If the interval runs from -2% to 19%, the data does not rule out no lift. | The estimate was positive, but the range is too wide for a confident lift claim. |
| "Awareness rose three points." | If the survey margin is larger than the movement, the change may be sampling noise. | The measured awareness difference is small relative to survey uncertainty. |
| "Channel A beat Channel B." | Overlapping intervals or different sample sizes may make the rank fragile. | Channel A had the higher estimate, but the comparison is not stable enough to rank with confidence. |
| "The model says this channel drove $1.2 million." | A modeled range may span several planning outcomes. | The model supports a broad contribution range, not a single planning value. |
| "The test was not significant, so it failed." | An underpowered test may be unable to distinguish a useful effect from no effect. | The test was inconclusive at this sample size and outcome window. |
Claim-boundary scoring pass
Before a readout becomes a recommendation, assign the interval pattern to one evidence level. The score is not a statistical replacement; it is a practical guardrail for the sentence a reader, buyer, analyst, or editor is allowed to write.
| Score | Interval pattern | Decision language allowed | Next action |
|---|---|---|---|
| 4 - Decision-grade | The entire interval clears the prewritten action threshold, and the outcome matches the decision. | The evidence supports the stated action within the tested population, period, and outcome definition. | Use the decision, then monitor whether the next readout stays inside the same boundary. |
| 3 - Bounded positive | The range is mostly favorable, but the lower bound is near the threshold or the outcome is slightly narrower than the decision. | The result supports a limited action or follow-up test, not a broad performance claim. | Keep the claim conditional and collect the missing outcome, segment, or maturity evidence. |
| 2 - Directional | The point estimate is favorable, but the interval crosses zero, crosses the action threshold, or is too wide for a strong decision. | The estimate is directionally favorable, but the readout is not decision-grade. | Use for learning, planning, or a better-powered test rather than scale, renewal, or proof language. |
| 1 - Descriptive only | The interval is missing, applies only to a proxy, or is shown for a slice without comparable sample and variance details. | The report describes an observed pattern but does not establish reliable lift or movement. | Ask for the denominator, interval method, assignment unit, and outcome window before approving stronger wording. |
| 0 - Blocking | The range allows material harm, the comparison is broken, or the outcome definition changed after results were visible. | The result should not be used as a success claim. | Repair the design, rewrite the claim as unsupported, or separate the readout from the decision. |

What platform readouts actually expose
Interval language is only useful when the report names the interval, outcome, and comparison behind it. These first-party references show why the same habit applies across platform experiments, lift studies, and modeled planning results.
| Readout context | Verified source detail | Reader check |
|---|---|---|
| Google Ads lift studies | Google Ads explains confidence intervals and certainty of lift; its lift results use an 80% two-sided interval and separate point estimate from range. | Record the interval type, bounds, certainty, metric, and whether the interval crosses zero or the action threshold. |
| Search Lift | Google Ads describes a point estimate, confidence interval, and certainty of lift as separate parts of the experiment readout. | Do not rank segments from the point estimate alone; inspect overlap, bases, and the comparison unit. |
| Campaign experiments | Google Ads experiment reporting includes a confidence-interval setting and metric comparison, with 80% as the default in the documented scorecard. | Write down the selected interval level and the metric definition before comparing experiment and original campaign. |
| Conversion Lift methods | Google Ads explains that Bayesian Conversion Lift uses credible intervals whose interpretation differs from frequentist confidence intervals. | Label the interval method and do not transfer a confidence-interval explanation to a credible interval without checking the method note. |
| Marketing mix models | Google Meridian documents geo structure, priors, media transformations, and model parameters that shape modeled uncertainty. | Ask which model specification, priors, geography, calibration, and sensitivity checks produced the range. |
Sources were checked for this source trail. Platform definitions and reporting defaults can change; preserve the exact report export, interval level, and method notes used for a decision.
What the verified sources establish
Google Ads distinguishes a point estimate from its uncertainty display and documents that Bayesian Conversion Lift uses credible intervals whose interpretation differs from a frequentist confidence interval. In the cited help, an 80% credible interval is interpreted as an 80% probability statement about the lift after combining study data with historical campaign information.
Google Meridian documents a geo-level hierarchical model with nonlinear media transformations, random regional coefficients, and configurable priors. A modeled range therefore depends on the model specification, not only on the displayed point estimate. These platform definitions do not validate the page's simulated numbers or decide whether a reader's business threshold was met.
Worked downgrade example
A campaign readout says conversions rose 8%. The confidence interval runs from -1% to 17%, the planned action threshold was a 5% lift, and the report highlights one high-performing audience slice without interval details. The point estimate is useful, but the range changes the strongest supportable conclusion.
| Review step | What the readout shows | Claim-boundary consequence |
|---|---|---|
| Point estimate | +8% reported conversion lift. | The result points in the favorable direction, so it can stay in the learning record. |
| Interval | -1% to 17%. | The plausible range still includes no effect, so the readout cannot say the campaign proved lift. |
| Action threshold | 5% was the prewritten renewal threshold. | Because the lower bound is below the threshold, the result does not clear the renewal decision on its own. |
| Slice claim | One audience segment is called a winner, but no segment interval is shown. | The segment should be treated as a hypothesis until comparable uncertainty is visible. |
| Allowed sentence | The estimate was favorable, but the range was too wide for a firm lift or renewal claim. | Score the readout as 2 - Directional, then plan a better-powered follow-up or narrow the decision. |
Simulated Worked Example: choose a bounded action
Simulated Worked Example - not a real campaign report. Assume a fictional randomized readout has 20,000 analyzed units in each arm, a conversion rate of 2.00% in control and 2.40% in treatment, and an illustrative absolute-lift interval from -0.10 to +0.90 percentage points. The arithmetic makes the claim boundary reproducible without presenting invented campaign data as evidence.
| Field | Calculation | Result | Decision meaning |
|---|---|---|---|
| Control conversions | 20,000 × 2.00% | 400 | Baseline outcome is visible. |
| Treatment conversions | 20,000 × 2.40% | 480 | Treatment has 80 more observed conversions. |
| Absolute lift | 2.40% - 2.00% | +0.40 percentage points | The point estimate is favorable. |
| Relative lift | 0.40 ÷ 2.00 | +20.00% | Relative lift is not a substitute for the base rate. |
| Illustrative interval | -0.10 to +0.90 percentage points | Includes zero and the +0.50-point action threshold | The range is compatible with no effect and with clearing the threshold. |
| Bounded decision | Score against the claim-boundary table | 2 - Directional | Repair or extend the test and keep the result out of firm scale or renewal language. |
The example assumes equal assignment, a stable conversion definition, complete outcome capture, and an interval calculated under a method appropriate to the design. It does not account for multiple comparisons, interference, delayed conversions, or changes in the eligible population. If any of those assumptions fail, the safe conclusion becomes weaker; if a preregistered interval clears the threshold and the outcome matches the decision, the conclusion could become stronger.
Simulated Worked Example: interval acceptance gate
Simulated Worked Example - a reproducible worksheet, not a real study. Apply six gates to the fictional readout above before allowing renewal, scale, or proof language. A gate passes only when the field is visible and the stated decision can be reconstructed from it.
| Gate | Check against the fictional readout | Result | Why it matters |
|---|---|---|---|
| Denominator and assignment | 20,000 analyzed units are stated for both control and treatment. | Pass | The base for the two conversion rates is explicit, subject to the equal-assignment assumption. |
| Outcome matches decision | Conversion rate is the outcome and the action threshold is a conversion lift threshold. | Pass | The worksheet does not substitute a proxy for the decision metric. |
| Arithmetic is reconstructable | 400 control conversions, 480 treatment conversions, +0.40 percentage points, and +20.00% relative lift. | Pass | A reader can reproduce the point estimate from the displayed inputs. |
| Interval method is documented | The range is explicitly illustrative, but no confidence or credible-interval method is supplied. | Fail | The result cannot be treated as a platform or statistical report until the interval method is named. |
| Range excludes no effect | -0.10 to +0.90 percentage points crosses zero. | Fail | The evidence remains compatible with no lift and cannot support a firm positive claim. |
| Range clears the threshold | The lower bound of -0.10 is below the +0.50-point action threshold. | Fail | The readout does not clear the prewritten commercial hurdle. |
Worksheet result: 3/6 gates pass. The arithmetic is usable for learning, but the missing method and two range tests block renewal or scale language. A stronger conclusion would require a named interval method, a mature outcome definition, and a range whose lower bound clears the decision threshold. This worksheet is a guardrail, not a substitute for the underlying experiment or model.
Minimum disclosure checklist
- State the point estimate and the interval together.
- Name the interval type: confidence interval, credible interval, margin of error, model range, bootstrap interval, or another method.
- Show the sample size, eligible population, assignment unit, and outcome window behind the estimate.
- State the prewritten decision threshold, such as minimum lift, margin hurdle, material percentage-point change, or renewal criterion.
- Separate planned comparisons from exploratory slices.
- Show whether adjustments, weighting, clustering, model priors, or multiple-comparison rules changed the interval.
- Explain which decision the interval can support and which stronger claim remains unsupported.
Decision language
| Evidence pattern | Supportable decision language | Do not say |
|---|---|---|
| Interval includes material loss, no effect, and material gain. | The result is inconclusive; improve design, sample size, outcome quality, or test duration. | The campaign worked because the point estimate was positive. |
| Interval is positive but below the commercial hurdle. | The measured effect may exist, but it may not clear the decision threshold. | The test proves the budget should scale. |
| Interval clears the hurdle and the design matches the decision. | The result supports the stated action within the tested population, period, and outcome definition. | The result will generalize to all future campaigns. |
| Intervals are missing for key slices. | The slice ranking is descriptive and should be treated as a hypothesis. | The top slice is the winner. |
| Interval is precise for a proxy outcome only. | The proxy result is clearer, but business impact still needs matching evidence. | The proxy proves sales, margin, or belief change. |
When the interval is missing
Some useful reports arrive without full uncertainty math. That does not make them useless, but it does change the claim boundary. Ask for the denominator, sample, assignment unit, outcome maturity, and a reason the report cannot show uncertainty. Until those fields are visible, use descriptive language.
Ask for denominator
How many people, accounts, markets, impressions, stores, survey responses, or conversions support the estimate?
Ask for maturity
Which cohorts have completed the outcome window, and which are still waiting for delayed conversions or survey collection?
Ask for threshold
What change would be large enough to alter spend, creative, sourcing, wording, or renewal decisions?
Takeaway
An uncertainty interval is not a technical footnote. It is the boundary around the claim. If the interval is wide, missing, tied to the wrong outcome, or below the decision hurdle, the conclusion needs quieter language.