Lead quality measurement
Landing page and lead quality measurement checklist
Organization byline: Measurement Press editorial desk. This page does not list an individual author or reviewer. Read the editorial method and corrections policy.
About 13 min read
Lead-generation campaigns often get judged by the easiest number to count: form fills, demo requests, downloads, or attributed conversions. That number can hide whether the campaign brought qualified people, whether the landing page filtered them fairly, and whether sales follow-up turned interest into a usable business signal.
Use this checklist before a flight launches and again when the readout arrives. It is written for advertisers, publishers, agencies, analysts, and revenue teams that need to separate media quality, page quality, offer quality, lead quality, and incremental demand.
Picture a renewal meeting where the campaign has plenty of form fills but the sales team says the leads were soft. The useful question is not whether marketing or sales is right. The useful question is where the evidence chain changed: the source context, the click quality, the page promise, the form filter, the routing coverage, or the comparison design.

Keep each job separate
A lead report is usually a stack of different systems. If the report only shows the final count, it is hard to know whether the campaign worked, the page converted, the form was too loose, or the follow-up process changed.
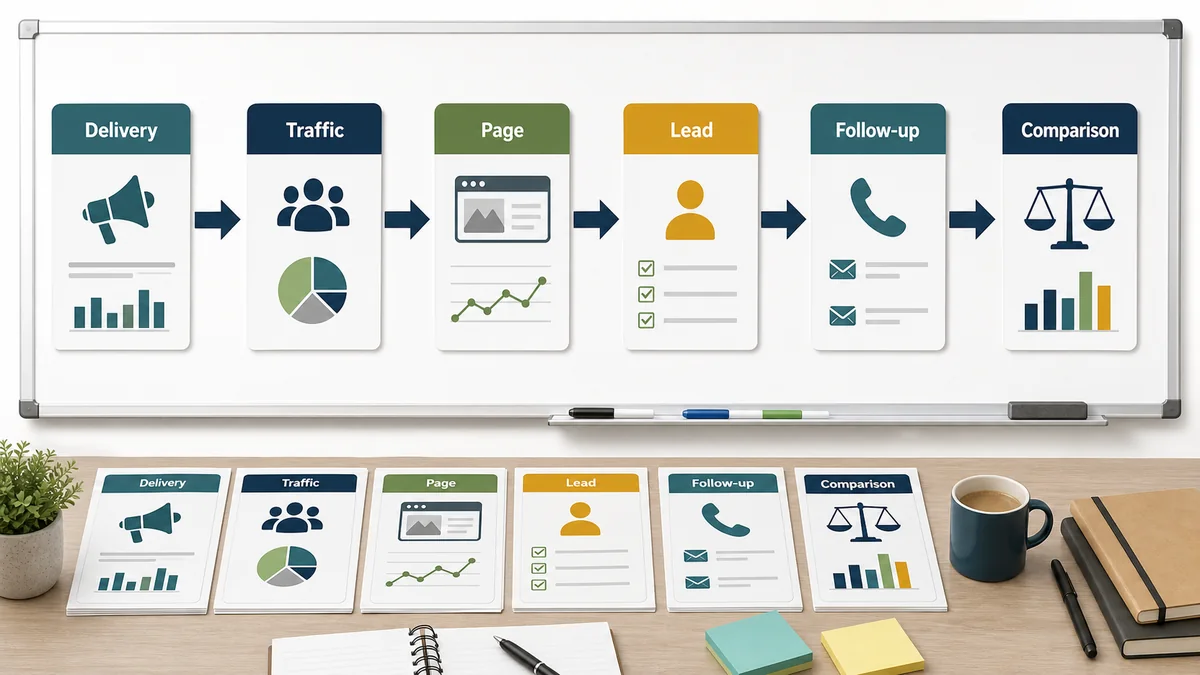
| Layer | What it can show | What it cannot prove alone |
|---|---|---|
| Media delivery | The campaign reached the planned context, placement, device mix, geography, and timing. | That the audience was qualified or that the campaign created demand. |
| Traffic quality | Visitors clicked through and behaved like real, relevant readers or buyers. | That those visitors were incremental or ready for sales contact. |
| Landing-page conversion | The page, offer, form, and load experience converted a share of visitors. | That the media source was better than another source. |
| Lead qualification | The submitted records met a defined business standard after filtering. | That every qualified lead was caused by the campaign. |
| Sales follow-up | Qualified leads received timely routing, contact, disposition, and stage updates. | That lead quality was low if follow-up coverage was incomplete. |
| Incrementality | A comparison design estimates what changed because of the campaign or treatment. | That the same result will repeat across every page, offer, audience, or sales motion. |
Pre-flight brief
1. Define a qualified lead before launch.Write the required fields, disqualifiers, duplicate rule, geography, company or consumer fit, budget or need signal, consent status, and minimum contactability standard before results are visible. Google Ads distinguishes a qualified lead from a converted or closed lead, so keep those stages separate when importing downstream outcomes into the campaign report.
2. Name the landing-page job.Decide whether the page should educate, capture a high-intent request, qualify a webinar audience, start a trial, route a sales inquiry, or distribute a report. A page cannot be evaluated without knowing its job.
3. Preserve the source trail.Use consistent campaign parameters, creative names, placement IDs, destination URLs, and offer IDs so a lead can be tied back to the correct context without pooling unlike traffic.
4. Set quality gates.Choose the minimum traffic-quality, form-completion, qualified-rate, duplicate-rate, sales-accepted-rate, and follow-up coverage thresholds that determine whether the readout is usable.
5. Choose the comparison.Decide whether the campaign will be compared with a prior flight, matched context, reserved holdout, geo split, or no baseline. If there is no comparison, keep the readout descriptive. A page or form can improve observed conversion without proving that the media created incremental demand.
Report packet
The readout should show enough detail to locate the weak link. A strong lead count with weak source detail is difficult to act on.
| Packet item | Include | Why it matters |
|---|---|---|
| Campaign context | Placement, page group, device, geography, creative, message, offer, date, and destination. | Separates media context from creative and landing-page effects. |
| Traffic quality | Sessions, engaged sessions, bounce or short-session share, return visits, invalid-traffic review, and landing-page load issues. | Raw clicks can reward accidental, low-quality, or poorly matched visits. |
| Form funnel | Page views, form starts, form completes, required fields, error rate, abandonment points, and mobile completion rate. | A strong audience can be wasted by page friction or unclear offer value. |
| Lead filters | Duplicates, invalid records, unreachable contacts, disqualified reasons, spam review, and suppressed records. | Lead volume without filters can make a source look better than it is. |
| Sales status | Routed leads, contacted leads, response time, accepted leads, rejected leads, stage movement, and no-follow-up records. | Lead quality cannot be read cleanly when follow-up coverage is uneven. |
| Comparison | Prior-flight baseline, matched context, holdout, market split, or explicit no-comparison note. | Determines whether the report can support descriptive, directional, or causal language. |
Diagnosis table
When the readout looks mixed, move through the funnel in order. Do not call the source weak until page behavior, form friction, qualification filters, and follow-up coverage have been checked.

| Observed pattern | Likely question | Next check |
|---|---|---|
| High clicks, low engaged sessions. | Was the traffic relevant, valid, and aligned with the landing page promise? | Inspect placement context, creative wording, device mix, accidental clicks, and page speed. |
| High engaged sessions, low form starts. | Did the offer or call to action match the reader's intent? | Compare message, page headline, proof points, field count, and mobile layout. |
| High form starts, low completions. | Is the form creating avoidable friction? | Review required fields, validation errors, privacy wording, autofill, and mobile behavior. |
| High lead volume, low qualification. | Did the form accept easy volume instead of useful demand? | Audit disqualification reasons, duplicate rules, incentive quality, and required fit fields. |
| High qualified rate, low sales acceptance. | Do marketing and sales share the same qualification definition? | Compare routing rules, lead notes, follow-up time, rejection reasons, and source expectations. |
| Strong attributed pipeline, no holdout. | Would the same accounts or buyers have converted anyway? | Use a matched baseline, audience holdout, geo split, or incrementality plan before making causal claims. |
Readout language
Lead reports can be very useful without pretending to be causal. The conclusion should match the comparison design and the quality checks available.
| If the evidence shows | Cleaner wording | Overclaim to avoid |
|---|---|---|
| Strong traffic quality and no outcome comparison. | The campaign produced qualified observed visits from the planned contexts. | The campaign created incremental demand. |
| One landing page converts better. | The page produced a higher observed completion rate and should be checked for traffic mix and lead quality. | The page is the best business outcome path. |
| Lead volume rose while qualification fell. | The campaign increased submitted records but reduced average lead quality under the current filter. | The campaign improved pipeline. |
| Sales follow-up was incomplete. | Lead-quality conclusions are limited because disposition coverage was uneven. | The source produced weak leads. |
| A protected comparison shows lift. | The campaign produced measured incremental leads for this design, audience, window, and quality definition. | The same lift should apply to every future campaign. |
Score the next action
Use the score as a meeting control, not as a universal grade. It tells the team whether the next step is a page fix, a filter change, a follow-up cleanup, or a stronger comparison before any causal language is used.
| Evidence area | 0 points | 1 point | 2 points | Next-action trigger |
|---|---|---|---|---|
| Source trail | Leads cannot be tied back to placement, creative, device, destination, or offer. | Some source fields exist, but important rows are pooled or missing. | Every lead row preserves campaign, placement, creative, destination, device, and offer fields. | Repair tracking before judging source quality. |
| Page and form quality | Load, message match, form errors, or mobile completion are unknown. | Page and form records exist, but the failure point is not isolated. | Sessions, starts, completions, errors, and abandonment points are visible by source and device. | Fix the page or form before changing media mix. |
| Lead qualification | Raw form fills are counted as usable demand. | Basic filters exist, but disqualification reasons or duplicates are incomplete. | Qualified, duplicate, invalid, unreachable, and disqualified records are separated before reporting. | Tighten the lead definition or filter before renewal. |
| Follow-up coverage | Sales routing, contact, acceptance, and rejection status are missing. | Coverage is partial or late enough to limit the conclusion. | Routing, first response time, acceptance, rejection reasons, and no-follow-up records are visible. | Close the status window before blaming the campaign. |
| Comparison strength | No baseline or holdout is named. | A prior flight or matched context is named with limits. | A protected holdout, geo split, matched market, or pre-registered comparison is available. | Add a comparison before saying the campaign created demand. |

Simulated worked lead-quality gate
Use this as a reproducible worksheet pattern, not as a Measurement Press campaign result. The numbers below are simulated so the arithmetic is visible and can be replaced with a real export.
| Funnel checkpoint | Simulated count | Calculation | Interpretation |
|---|---|---|---|
| Landing-page sessions | 1,200 | Starting denominator | Do not pool unlike destinations or source contexts. |
| Form starts | 240 | 240 ÷ 1,200 = 20.0% | Interest or offer fit was observed; it is not lead quality. |
| Completed forms | 180 | 180 ÷ 240 = 75.0% | One quarter of starts did not complete; inspect errors and abandonment. |
| Valid and contactable leads | 126 | 126 ÷ 180 = 70.0% | 30.0% of submissions failed the stated validity or contactability rule. |
| Qualified leads | 54 | 54 ÷ 126 = 42.9% | Qualification is a downstream filter, not a synonym for a form fill. |
| Sales-accepted leads | 40 | 40 ÷ 54 = 74.1% | Acceptance is still descriptive unless routing coverage and comparison are complete. |
Simulated decision rule: 6/10, accept with a boundary.Score source traceability 2/2, page and form instrumentation 1/2, lead qualification 2/2, follow-up coverage 1/2, and comparison strength 0/2. The total is 2 + 1 + 2 + 1 + 0 = 6/10. The appropriate action is to repair follow-up coverage and add a protected comparison before using causal language; the current packet can support a descriptive statement about observed qualified leads only.
Assumptions: every row belongs to the same 30-day flight, counts are mutually exclusive at each checkpoint, and “qualified” and “sales-accepted” were defined before review. Limitations: the example does not estimate incremental lift, account for lead value, or show whether the source mix was comparable. Replace the counts, window, definitions, and comparison design with a real export before making a budget decision.
Stress-test the decision
Run the worksheet through plausible data-quality changes before carrying a lead-quality conclusion into a renewal or budget meeting. These are simulated sensitivity cases, not observations from a Measurement Press campaign. They show which assumption is carrying the recommendation.
| Simulated change | Reproducible calculation | What changes | Safe action |
|---|---|---|---|
| Baseline packet | 54 qualified / 126 valid = 42.9%; 40 accepted / 54 qualified = 74.1% | Qualification and acceptance are descriptive; comparison strength remains 0/2. | Repair follow-up coverage and add a protected comparison before causal language. |
| 12 valid/contactable records later fail the stated rule | 54 / (126 - 12) = 47.4%; 40 / 54 = 74.1% | The qualified rate rises because the denominator was unstable; that is a data-quality finding, not proof of better traffic. | Freeze the validity rule and retain the exclusion reason on every row. |
| 12 qualified records later fail the qualification rule | (54 - 12) / 126 = 33.3%; 40 / (54 - 12) = 95.2% | Qualification weakens while acceptance appears stronger; the original gate was not stable enough for source comparison. | Separate qualified and accepted stages and review the disqualification reasons. |
| 10 accepted records lack complete follow-up status | (40 - 10) / 54 = 55.6% status-observed acceptance | The observed outcome is incomplete even though the raw accepted count is unchanged. | Close the status window before judging source or landing-page quality. |
Stress-test rule: if a plausible cleanup changes the action, keep the conclusion descriptive.Preserve the raw count, corrected count, rule version, and exclusion reason side by side. A stable lead-quality decision requires the same definitions across source, page, qualification, and follow-up records; it still does not establish incremental demand without a valid comparison.
Implementation checks from first-party guidance
These checks turn the funnel into an auditable handoff rather than a collection of platform screenshots.
Source-use boundary: the linked Google Ads guidance informs the implementation checks below: Quality Score is a diagnostic signal, the Landing pages report exposes mobile and destination checks, and offline-import guidance distinguishes qualified and converted stages and recommends separate conversion actions. Those sources do not validate the simulated counts, thresholds, lead values, or any campaign result on this page.
- Google Ads Quality Score guidance treats landing-page experience as relevance and usefulness to the person who clicked; compare the ad promise, page message, navigation, mobile experience, and load speed before blaming traffic.
- Google Ads landing-page reporting guidance recommends checking expanded landing pages, mobile-friendly click rate, clicks, impressions, and CTR; preserve those cuts by destination rather than reporting one pooled page rate.
- Google Ads offline conversion FAQs distinguish qualified leads from converted or closed leads and recommend checking conversion counts by conversion time against upload results; retain stage and timestamp fields in the CRM join.
- Google Ads offline-import guidance calls out GCLID, user-provided data when permitted, BRAIDs, conversion timestamps, and unique order IDs; use the available identifiers and deduplicate before downstream lead counts are compared.
| Verified source boundary | Use in this checklist | Still requires production evidence |
|---|---|---|
| Quality Score treats landing-page experience as a relevance and usefulness diagnostic, alongside ad relevance and expected clickthrough rate. | Compare the ad promise, page message, navigation, mobile experience, and load speed before assigning a weak result to the traffic source. | A diagnostic status does not prove lead quality, conversion value, or incremental demand; retain page-level and lead-stage records. |
| The Landing pages report exposes expanded URLs, mobile-friendly click rate, clicks, impressions, CTR, and destination-level cuts. | Keep destination, device, and reporting-window fields together so unlike pages are not pooled into one conversion rate. | Account reports still need a reproducible export, valid page/version mapping, and an explanation of missing or redirected destinations. |
| Google separates qualified leads from converted or closed leads and recommends conversion-time comparisons against upload results. | Use distinct qualification, sales-accepted, and closed stages with timestamps rather than treating every form fill as one outcome. | Stage definitions, CRM ownership, accepted/rejected reasons, rejected uploads, and deduplication must be verified in the production join. |
| Offline-import guidance identifies join fields such as GCLID, conversion time, user-provided data when permitted, BRAIDs, and unique order IDs. | Preserve the identifier and privacy-safe matching path needed to connect a lead to its campaign, destination, and later status. | A joinable identifier does not establish causality; a valid comparison or lift design is still required for incremental claims. |
Boundary: these official definitions support the checklist's implementation and claim ceilings. They do not validate the simulated counts, thresholds, lead values, or any campaign result on this page.
Quality fields to keep
Source fields
Campaign, placement ID, content context, creative, message, destination, device class, geography, date, and buying path.
Page fields
Page variant, offer, load issue, form start, form completion, field error, abandonment point, and mobile completion.
Lead fields
Duplicate flag, invalid flag, fit status, disqualification reason, routed owner, first response time, accepted status, and stage movement.
Meeting script
- Which lead definition was locked before the campaign started?
- Did the source trail preserve placement, creative, destination, device, and offer?
- Where did the funnel lose the most people: click, session quality, form start, completion, qualification, or follow-up?
- Which rejected leads were bad traffic, and which were useful people blocked by offer, form, or routing rules?
- What comparison lets us say this source performed better than another source?
- What should change next: creative, context, page, offer, form, routing, or the test design?
Pair with
Use this checklist with the landing page launch QA worksheet before paid traffic goes live, the creative and destination troubleshooting matrix when response breaks between clicks, engaged sessions, form starts, completions, and accepted leads, the campaign KPI dictionary for metric language, the campaign readout QA checklist before a renewal decision, the private marketplace campaign measurement checklist before launch, the identity matchback checklist when outcomes are joined after the flight, and the incrementality test plan template when the lead report needs causal evidence.